Figure 1: Graphical representation
of the rstat information
Artificial Replication of Network Load
Environment for Distributed Computing
Dispatching Algorithms Comparison
|
|
|
Presentado en las Conferencias de IEEE Uruguay (Montevideo, 1999). Exposición a cargo de N. Calero y A. López.
This paper describes the framework developed for testing and comparing
different task dispatching algorithms. The virtual computer is a non-dedicated,
heterogeneous cluster of UNIX workstations. The algorithms are expected
to take advantage of a forecast of the system load. The comparison could
be done only if the external usage could be replicated. Given a historical
time serie of CPU load, disk usage and network traffic of a group of networked
computers, the developed code is able to replicate all of them at any time.
The results obtained were very good for CPU and traffic, and acceptable
for disk.
Parallel architectures are nowadays wide spread. With the growth of node power and the increases of network bandwidth, present networks can be used as powerful parallel environments. This kind of hardware support for distributed processing can be found in a growing number of companies and universities.
However, software support for efficiently use this kind of architectures is still not good enough. There is almost no visual environment for developing distributed systems, and the ones that exist are extremely expensive. On the other hand, they are (in many senses) under-developed. In addition, they only have rudimentary tools to cope with unexpected overload in a node. This usually leads to a significant delay in the computation time.
The UruParallel project [9] proposed to improve PVM [3] dispatching algorithms in order to use historical information about the use of the computers that compose the virtual machine. New algorithms based in neural networks techniques and traditional statistical methods (ARMA, ARIMA) were used to predict future usage of individual workstations based on historical usage. In order to compare two forecasting algorithms under the same workload environment, two instances of the same program with just the dispatching criteria changed should be run. However, this executions should run in a background load environment as similar as possible.
The aim of this project was to give support for replicating, at any time, a given network load situation. With this artificially generated background workload, one could fairly compare different solutions for the dispatching of a distributed program. The input will be, for N workstations, a time serie of the load observed in each for some representative parameters, and the output will be each workstation loaded with the prescribed load.
Assumptions and Meaningful Parameter Determination
Unix systems provide at many levels of detail information
about system usage [4]. We decided to work completely outside the kernel,
and not to request root privileges in order to run the replications. The
load information is the one provided by the rstat
service, which is listed in table 1 and detailed in [12]. Figure 1 graphically
represents some of them.
|
|
|
| Cp_time | CPU usage (user, nice, system and idle) |
| Dk_xfer | Local (non NFS) disk usage |
| Pgpgin | Pages read |
| Pgpgout | Pages written |
| Pswpin | Swapping Pages read |
| Pswpout | Swapping Pages written |
| V_intr | Interrupts |
| If_ipackets | Packets received |
| If_ierrors | Errors detected in received packets |
| If_opackets | Packets sent |
| If_oerrors | Errors detected in sent packets. |
| If_collisions | Collisions detected in sending packets. |
| V_swtch | Context switches in running processes. |
| Avenrun | Average load for the last 1, 5 and 10 minutes, measured as the average number of processes in the running queue. |
| Boottime | Workstation boot time |
| Curtime | Current time (struct timeval) |
Figure 1: Graphical representation
of the rstat information
Looking for simplicity and transparent processing, we discarded some parameters that have no effect in global load patterns. For example, kernel operations like context switching were ignored because they are extremely hard to trace and replicate, and they do not affect global workstation performance [1]. Also, parameters related with misconfiguration problems (for example, if excessive swapping and paging is observed possible there is memory leak) were ignored. On the other hand, parameters that hardly change or are not meaningful over the time (like collisions) also were neglected.The virtual machine we used for this project is composed of heterogeneous computers, but all driven by different flavours of UNIX. The subsets of computers used for this project are shown at figure 2, and include Alpha/DigitalUNIX, Sparc/SunOS, Intel/Solaris, Sparc/Solaris and Intel/Linux workstations.The identification of suitable load indexes is not a new problem [7], and is well known that simple load indexes are particularly effective. Kunz [2] found that the most effective of the indexes we have mentioned above is the CPU queue length. However, due to the specific topic we are managing (network parallel computing) where network traffic is a bottleneck and distributed processes usually make great use of local disk, we considered that this two indexes should not be neglected.
Under these assumptions, we will replicate just CPU, disk and network usage for each workstation.
Communications were supported by a 10 Mbit switched Ethernet
network, shared with many hundreds of computers of the University.

Figure 2: computers used during this project.
As replication processes will all need the same historical information, a shared memory region was generated, so all processes could access to the same data with just one disk read. Figure 3 shows this architecture. This structure will minimize the extra load required by the replicator process itself.
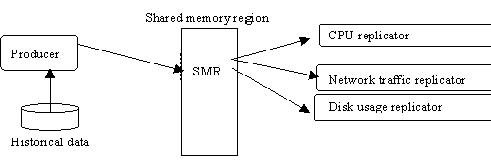
Figure 3 Data flow between processes
One process will take care of each parameter replication, specializing in doing its best job with as low correlation as possible with other parameter replicators. As will be explained below, there still exist some correlations between parameters that have been hard or impossible to overcome.
Although this is a traditional design [10][11], it performs an excellent compromise between the required functionality and the overhead generated by this new network services.
Replication is not a new research area, and it is needed for testing purposes in many computer science areas. Workload replicators for measuring performance of different file system implementations were studied in [13][14]. Also replicators for real-time system applications were developed that work at the kernel level, obtaining excellent results for very short periods of time [7].
As our purpose is to replicate workloads in a complete network with many parameters of each workstation, we dont need excessive precision in the replication at the microsecond scale, but we expect acceptable results for the long periods (like hours). So we decided to work at the process level.
This is achieved using processes that generate artificial load, to arrive to the historical load values, in case that it will be necessary. Given the load X1 in the interval T1, the load process is created so it generates an equivalent historical load to the difference between the historical and actual load (H1-X1). In the next load measurement T2 (next interval to replicate), the artificial load process previously created is killed and a one new is created, with the wished artificial load value updated (H2-X2) as shown in figure 4.

As we decided to work without root privileges, in case actual load it is not possible for our process to decrease CPU usage of another process (for example, managing processes priorities). So, our replicators will be able to increase load but not to decrease load generated by other users processes.
Despite its simplicity, this strategy works fine. We can
visually compare the historical load (figure 5) and the replicated one
(figure 6). Vertical axis shows the percent of CPU used during the measured
interval, with increments in the range 1-100 per second. Horizontal axis
indicates historical measurements, taken as 60 seconds in these experiments.
These units are used in all experiments shown in this paper, unless is
specified.
Figure 5 Historical CPU load Figure 6 Replicated CPU load
CPU load replication process structure is shown in figure 7. The same schema was applied for disk and network replicators, just changing the inner part of the code (load generator itself).
| tx = pcarga * (T_REPLICA/100);
pausa = (pcarga>100)? 0 : ((100-pcarga) * (T_REPLICA/100)); while (1) { /* Work
until being killed ..*/
/* Calculate
end time, according to given interval */
/* Work hard
until reaching given percentage.. */
|
Errors obtained for CPU replication are shown in figure
8. Working with a 60 seconds interval, average deviation was of 0,97 while
the maximum deviation was 5. The vertical axis units are those provided
by rstat.
Figure 8 Average deviation in CPU load replication, per second.
Figures 9 and 10 show results obtained when replicating disk usage. Note the scale difference; unfortunately, generated load was always lower than expected (for example, load generated when accessing a slow device (like CD-ROM units) was impossible to simulate). This could be solved by interacting directly with the raw device, bypassing the kernels cache. Further work will be done in this direction.
Network Traffic Replicator
A network server was implemented whose only role is to serve any clients traffic generation needs, forking a new server for each one. Note that this server could run in any workstation located at the same network but not being replicated, so CPU load generated by this service does not affect CPU replication, avoiding interference between replication processes. The client process connects to the server through network sockets [5], sending data packets as it detects higher historical data than actual, and sleeping in any other case.


Figure 9 Historical disk usage Figure 10 Replicated disk usage
Figures 11 and 12 show obtained results. The average absolute deviation for each interval was of 25 packets/sec. Maximal generated load deviation compared to historical data was of 190, and minimal deviation was of 7. In this case, always generated load is higher that history, due to the fact that there is always traffic in the network. Also, deviation is high due to peak traffic during replication experiment.


Figure 11 Historical network traffic Figure 12 Replicated network traffic
Overhead generated by replication processes
In order to evaluate this overhead, producer and replicator processes could be run using zero historical data. Also, load overhead generated by the collector process was considered. Figure 13 shows generated load for both auxiliary processes involved in load replication. Load overhead observed was of 0.1 % of CPU used per second, so it could be neglected, and ensures that previous results were fairly good for our purposes.

Figure 13: generated load for both auxiliary processes involved in load replication
This work summarizes partial activities of a project devoted to improve the performance of a heterogeneous parallel virtual computer using non-dedicated UNIX workstations. In order to compare different dispatching strategies, background load should be replicated on request. We focused on CPU, disk and network traffic replication.
The developed programs could replicate historical load of selected networked workstations, with a relative precision of 99% when monitoring load once every minute. This allows us to test different dispatching algorithms running many instances of the same program (with just the dispatching criteria changed) under the same load environment.
Up to date information about this ongoing project (and some other related projects) could be found at http://www.fing.edu.uy/~itdc97
Further work will be required for improving disk load replicators, especially when dealing with slow devices. Concerning communications, some tests should be run in dedicated networks, and using faster protocols (100 Mbit FDDI and FastEthernet).
Also, although this project objective was to run in a UNIX environment, NT networks are growing very fast and could also be considered as a parallel machine that should not be neglected. In [15] we have studied their performance, running the same distributed applications both in UNIX and NT networks using exactly the same hardware and results were good. Considering this fact, we have an ongoing project [8] that is building a Parallel Machine based in Intel hardware running Microsoft Windows family operating systems and 100Mbit switched communications. As UNIX and NT operating system design are very different [1][6], one should not extrapolate the results obtained in this research to NT networks. So, this research should be done again in this kind of networks.