|
|
Illustrating 3D views
|
|
|
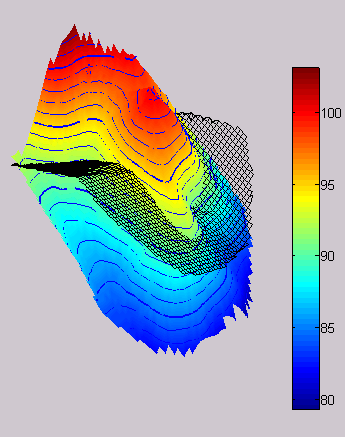
The figures show what could be achieved using EasyDEM®. The terrain is displayed using different colours for different height level, according to the height table displayed to the right. Red colours are for higher elevations, while blue ones for lower. The contour lines are superimposed to the previous image, including also the line width specified previously.
The reference surface is shown as a black grid. Through the free 3D rotation tools you can realize that it is composed of four planar sectors, divided by two orthogonal break lines. All the required elevation data are available in the CD.
|
|
|
Pick here to see a digital video about the steps required to achieve a similar result.
|
|


